Making Sense of Microfinance Pricing
By Ben Wallingford
Within the past year alone, MFTransparency has published pricing data from nine countries. I have had the pleasure of working on the Transparent Pricing Initiatives in Uganda, Rwanda, Tanzania, Malawi, Ghana, and most recently Kenya. Through collecting pricing data and calculating prices for these country projects, I have gained an appreciation for the importance of pricing transparency in microfinance. Thanks in large part to MFTransparency’s work over the past five years, transparency in pricing is now the expectation of MFIs committed to consumer protection all over the world.
MFTransparency, in partnership with Planet Rating and with funding from the MasterCard Foundation, recently published Country Pricing Reports (CPRs) analyzing the pricing data collected from five of these countries. After months of being involved in collecting MFI-specific pricing data, it was satisfying for me to engage in the big-picture analysis of each country’s unique loan products and pricing components, and it was fun to play around with and generate fascinating graphs utilizing MFTransparency’s new interactive analysis tool, the Truth-In-Lending (TILT) tables.
My key takeaway from the experience? Microfinance pricing is typically far more complex and messy than we think it is.
For example, it seems straightforward to compare one loan product’s price to another loan product’s price. However, with many loan products having variable price components (interest rate + fees + insurance + tax + compulsory deposit) and some other variable aspects (loan term, loan size, etc.) within the same product, it is quite rare that a loan product ever has one “price.” Rather, different clients getting the same loan product can be paying different prices.
For example, one Ghanaian loan product has a quoted nominal interest rate of 5% per month, calculated using the flat balance method. Each borrower is charged an upfront fee (1.5%) and an insurance fee (1%). Given this information, on the surface it seems likely that all clients that have accessed this loan product are paying a similar price. However, one pricing component for this loan product does vary – the compulsory deposit. All clients are required to deposit savings – upfront – before receiving a loan. The amount of this compulsory saving differs, across a wide range from 5 to 50 percent. A pricing component that is seen by many as “helping clients to save” can have a dramatic impact on the Full Annual Percentage Rate (APR). In this particular case, the difference in the compulsory deposit requirement equates to almost enough to double the cost of a loan. The cheapest sample collected had a required deposit of 27% and a Full APR of 195%, while the most expensive sample with the maximum requirement of 50% resulted in a whopping 374% Full APR.
Unlike the example above, some other loan products such as one from Uganda have the exact same pricing components applied to each loan – in this case, 18% declining balance interest and one upfront fee. However, the Full APR across five loan samples ranges from 20% to 75%. This is because the one upfront fee is charged using a fixed amount of 50,000 UGX (20 USD) instead of a percentage. As the fee does not vary based on the loan size, clients with smaller loans pay a higher relative amount and hence, a higher Full APR. For this particular loan product, the range in Transparency Index values is also large.
MFTransparency has developed a Transparency Index to measure the percentage of the Full APR communicated to the borrower through the quoted interest rate (click here for more information about the Transparency Index). A perfect score is 100, and the Transparency Index range for this loan product is 24 to 90 – indicating that, depending on the loan size, the quoted interest rate represents anywhere between 24% and 90% of the true price paid by the borrower.
Fortunately, MFTransparency has been publishing useful educational resources and reports on various aspects of microfinance pricing transparency for years. The groundbreaking Country Pricing Reports are no exception, providing an analysis of recently collected pricing data from five African countries. The Country Pricing Reports highlight intriguing trends for each country’s data. Below are some highlights of some of these findings for Uganda:
- Smaller loans tend to be more expensive: Anyone familiar with microfinance understands that a smaller loan is relatively more expensive for an MFI to service than a larger loan, due to fixed operational costs for each loan regardless of loan size. However, it is surprising how significant the difference is between smaller microloans and larger microloans. In this graph for Uganda, each bubble represents a loan product, with a bigger bubble indicating a loan product with more clients. The trend line clearly indicates an increase in the true price (Full APR, Y-axis) of a loan as the loan size (X-axis) decreases.

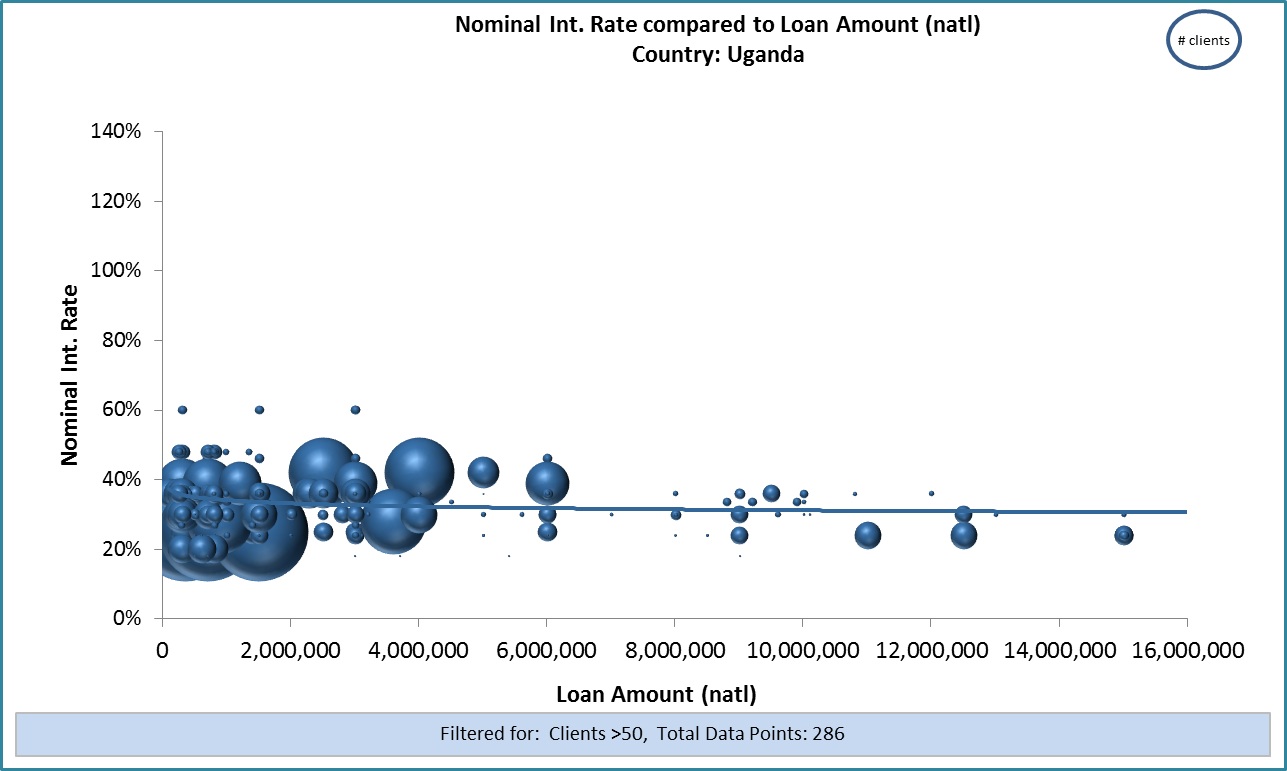
- Smaller loans tend to be less transparent: More frightening perhaps is the fact that regardless of loan size, microloans in Uganda are quoted with a similar interest rate. The graph below demonstrates this – the flat trend line indicates that the quoted interest rate communicated to the borrower (Y-axis) does not vary according to the size of a loan (X-axis). So not only are smaller loans more expensive, but they are also less transparent as a smaller portion of the true price is communicated to the borrower. There are in fact MFIs that have some of their loan products advertised in declining balance interest and other products in flat interest. Two products, in the same institution, can have quoted interest rates of 2% per month, but one product can be nearly twice as expensive as the other.
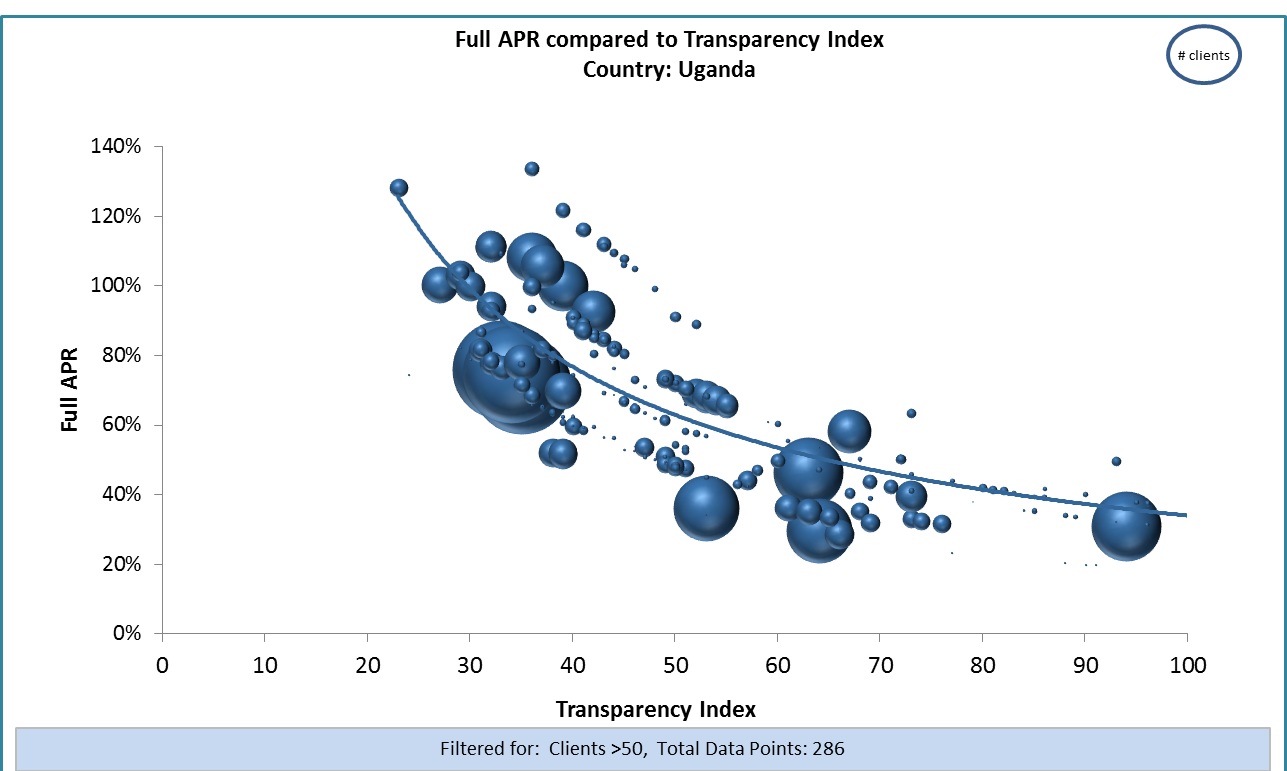
- More expensive loans tend to be less transparent: Combining the findings of the two graphs above by comparing the Full APR (Y-axis) and corresponding Transparency Index values (X-axis), we find that in Uganda (and other countries in the Sub-Saharan Africa region as well) as a loan product becomes more expensive, the communication of the loan’s true price becomes significantly less transparent.
 That’s enough of a sneak peek!
I encourage you to check out the pricing reports which are now available on the MFTransparency Resource Center.
Additional details are available by requesting the full TILT tables from MFTransparency at [email protected].
Now to figure out the trend of the data point bubbles on my curtains!
__________________________________________________________________________________________
 Ben Wallingford is a Junior Analyst at Planet Rating, a specialized microfinance rating agency offering evaluation and rating services to microfinance institutions (MFIs), using the Smart GIRAFE and Social Performance methodologies. Ben is based in Planet Rating’s East & Southern Africa office in Nairobi, Kenya and has rated MFIs in Ethiopia, Uganda, Tanzania, and South Sudan. Ben has participated in MFTransparency’s Transparent Pricing Initiatives in seven countries including Ghana, Rwanda, Malawi, Kenya, and Bolivia. Before joining Planet Rating, Ben worked for a US-based fair trade company and as a project manager for a Kenyan MFI. Ben holds a B.A. in Economics from Ohio Wesleyan University.


This is very wonderful material i have ever come across. my question is how do we work to ensure transparency prevails so that real mission/vision of this industry is attained. lot needs to be done if poor are to jump-start from poverty, otherwise, with hidden charges impose on poor borrowers will badly hinder their chances of becoming self-reliant
I share your concerns, Koma. The industry is losing ground with each day that we don’t clearly identify those MFIs who are fulfilling our industry criteria of “responsible practice”, of which transparency is one component.
But the industry has made next to no progress on that certification process yet. We do not have a list of certified responsible MFIs (beyond a list of 15 MFIs on the SMART Campaign website… but that represents only 15 of the 10,000 MFIs in the world), and we do not have a list of MFIs determined to *not* be acting responsibly.
We do have a list of the profitability levels of a few thousand MFIs (on the MIX website), but we don’t yet judge whether if those profits are very high, if they are coming at a cost to their clients. High, hidden prices charged to the poor can generate high profits. The industry just isn’t able yet to draw the connection between those two points and reach a decision on if that is responsible practice.