Zambia’s New Price Cap – Good Intentions with Unintended Consequences
Last week saw the sudden news of the immediate introduction of a price cap on microfinance by the Bank of Zambia. Welcomed by some and condemned by others, the impact and development of this government intervention in the microfinance market is being watched by the microfinance community with interest.
Price caps are increasingly common in microfinance and are present in many of the countries where MFTransparency has worked, including Ecuador, Colombia, South Africa, India and the WAEMU region amongst others. Whether price caps have the intended impact of lowering microfinance prices and preventing the exploitation of borrowers is a hotly debated topic.
There are a lot of points that can be discussed here, much depending on factors such as: 1) where the price cap is set, 2) how the price cap is measured, and 3) how much profit is currently being made on micro loans in the price cap country.
Governments sometimes implement “interest rate caps” as opposed to “price caps”. South Africa is a prime example, where the policy limits interest rates to 60%, but allows lenders to still charge true prices of up to 300% and 400% through the application of very large fees. (And these are nominal APR figures. compound EIR equivalents would be over 1000%. Click here to understand why these figures can be so different.) A “price cap” is more inclusive than an “interest rate cap” and is more common as regulators become wise to the subversive tactics invented by the lenders. The broader formula includes some other costs, such as processing fees, and sometimes includes the cost of other services that are bundled with the loan, such as insurance. (Click here for a chart that shows different regulation rules in different countries.) However, many price caps still have loopholes so that prices can still be higher than what the public are led to believe, the most common being the application of security deposits, or compulsory “savings” that can dramatically increase the true price of the loan.
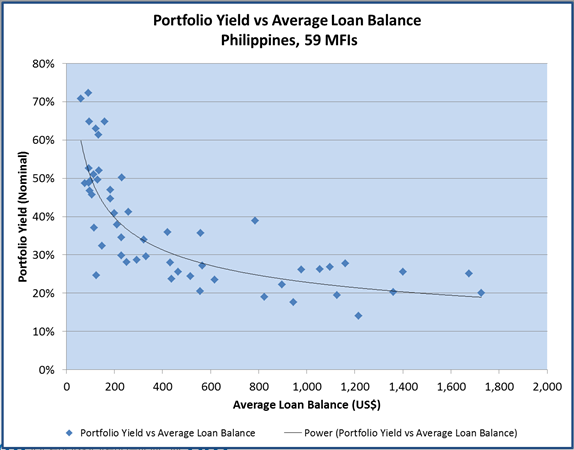
A clear argument against price caps is that they ignore the “price curve” seen in microfinance. Smaller loans require a higher real-price in order to cover the increased cost per unit of managing those loans. MFTransparency’s data shows that prices charged to the very poorest tend to be higher than prices charged to the middle-class. This is common to the majority of microfinance markets – for example as show in the graph below for the prices of microloans in the Philippines. Each dot represents a single MFI reporting data to the MIX. The x-axis shows the average loan balance per borrower, and the y-axis shows the portfolio yield for the institution.
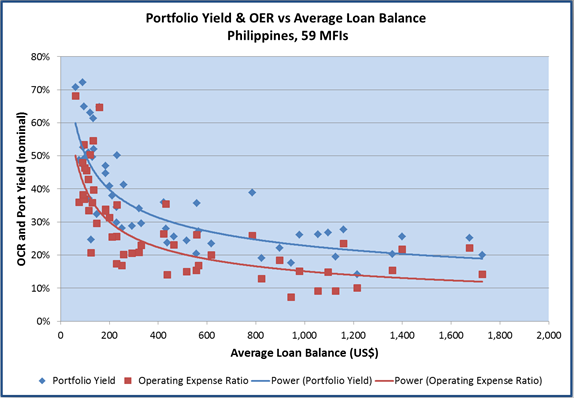
Why are prices higher on the smallest loan? The next graph adds Operating Expense Ratio data to the data of the previous graph. The operating expense ratio clearly increases as the loan size decreases. Consider costs of $100 to manage a $1000 loan balance. That results in an operating cost ratio of 10% that must be passed through in the price. If the MFI spends $100 to manage a $500 loan balance, the cost ratio doubles to 20%. If targeting even smaller loans, the costs must come down. Say the MFI streamlines processes and lowers staff costs to spend only $50 to manage a $100 balance. Despite the “cost per loan” now being cut in half, the operating cost ratio still escalates up to 50%. The result is the depicted cost curve. On the whole, the MFIs are setting prices that generate a higher portfolio yield completely in line with their higher operating expense ratios. Against intuition, higher prices do not mean higher profits. Profits result from pricing “off the curve”.
Given the increasing prices charged on the smallest loans, an unfortunate yet common feature of microfinance is an attempt by practitioners to miscommunicate the prices of loans in order to hide high prices – for example via the use of “flat” interest rates, complex fees and hidden charges. Hidden prices destroy the market. If the true price is not known then bad decisions are made by all stakeholders in the market transaction.
These flawed markets have created the opportunity for some to extract high profits – profits being generated from the poor. When that happens, the public gets upset. This leads to government intervention. The laws that get put forward are intended to lower these profits to a reasonable level, and the assumption is that capping the price will do so. But those laws are oblivious to the critical aspect of the “price curve”. So if the cap is set too low, it makes it impossible to cover costs on the smallest loans. Excessive profits are stopped, but so are modest profits and possibly even sustainability of the lender.
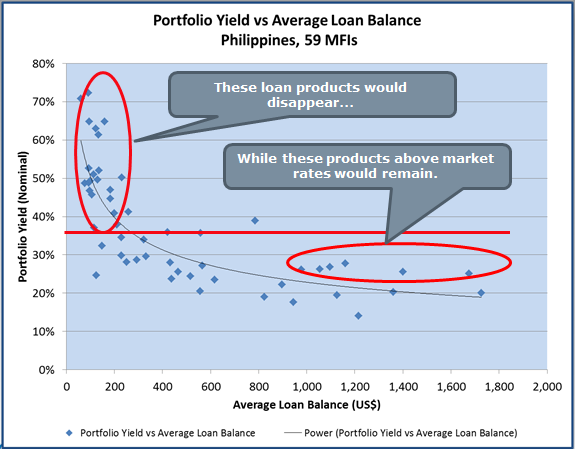
So in a case like the Philippines, if a price cap were set at an arbitrary rate, you can see that the smallest loans (those higher priced than the price cap) would disappear from the market. The poorer borrowers would be forced to return to money lenders for financial services – hardly a positive result.
The graph shows that only the larger loans could be legally delivered under a price cap regime. Also, the curve in microfinance means that price caps do not stop high-profit-making. If clients of those larger loans were not aware that some MFIs were charging much higher prices than the competition, some MFIs could make very high profits. The data points circled in red show products offered at a significantly higher price than the line showing market average rate – indicative of high profit generation from those loans.
Our pricing research in Zambia has revealed some of the highest prices charged globally in microfinance. That this needs to be addressed is not under question. The method that is used to address it is crucial. Price caps prevent the delivery of the smallest loans in microfinance, and do not stop profits being made from consumers of the larger microloans. Rather than “price caps”, what is needed to ensure consumers are protected from profiteering and are not financially excluded is “pricing transparency”.


Chuck this is an excellent article. Our average loans in Zambia are $150, which go to the rural poor. We believe that this level of loans and lower are needed in the rural sector, a sector that is so oten ignored by many of the larger players who concentrate on urban and salaried loans. Whilst doing this sustainabily is a challenge, we believe it is one that is worth taking on.
Alas this change of legislation by the Zambian governement which like you we are sure has been for the right motives (and in the case of pay day loans long overdue) will make it impossible for social operators to operate unless charges are directed to other areas. It is a tragedy for the poor and the country. Peter Ryan – MicroLoan